

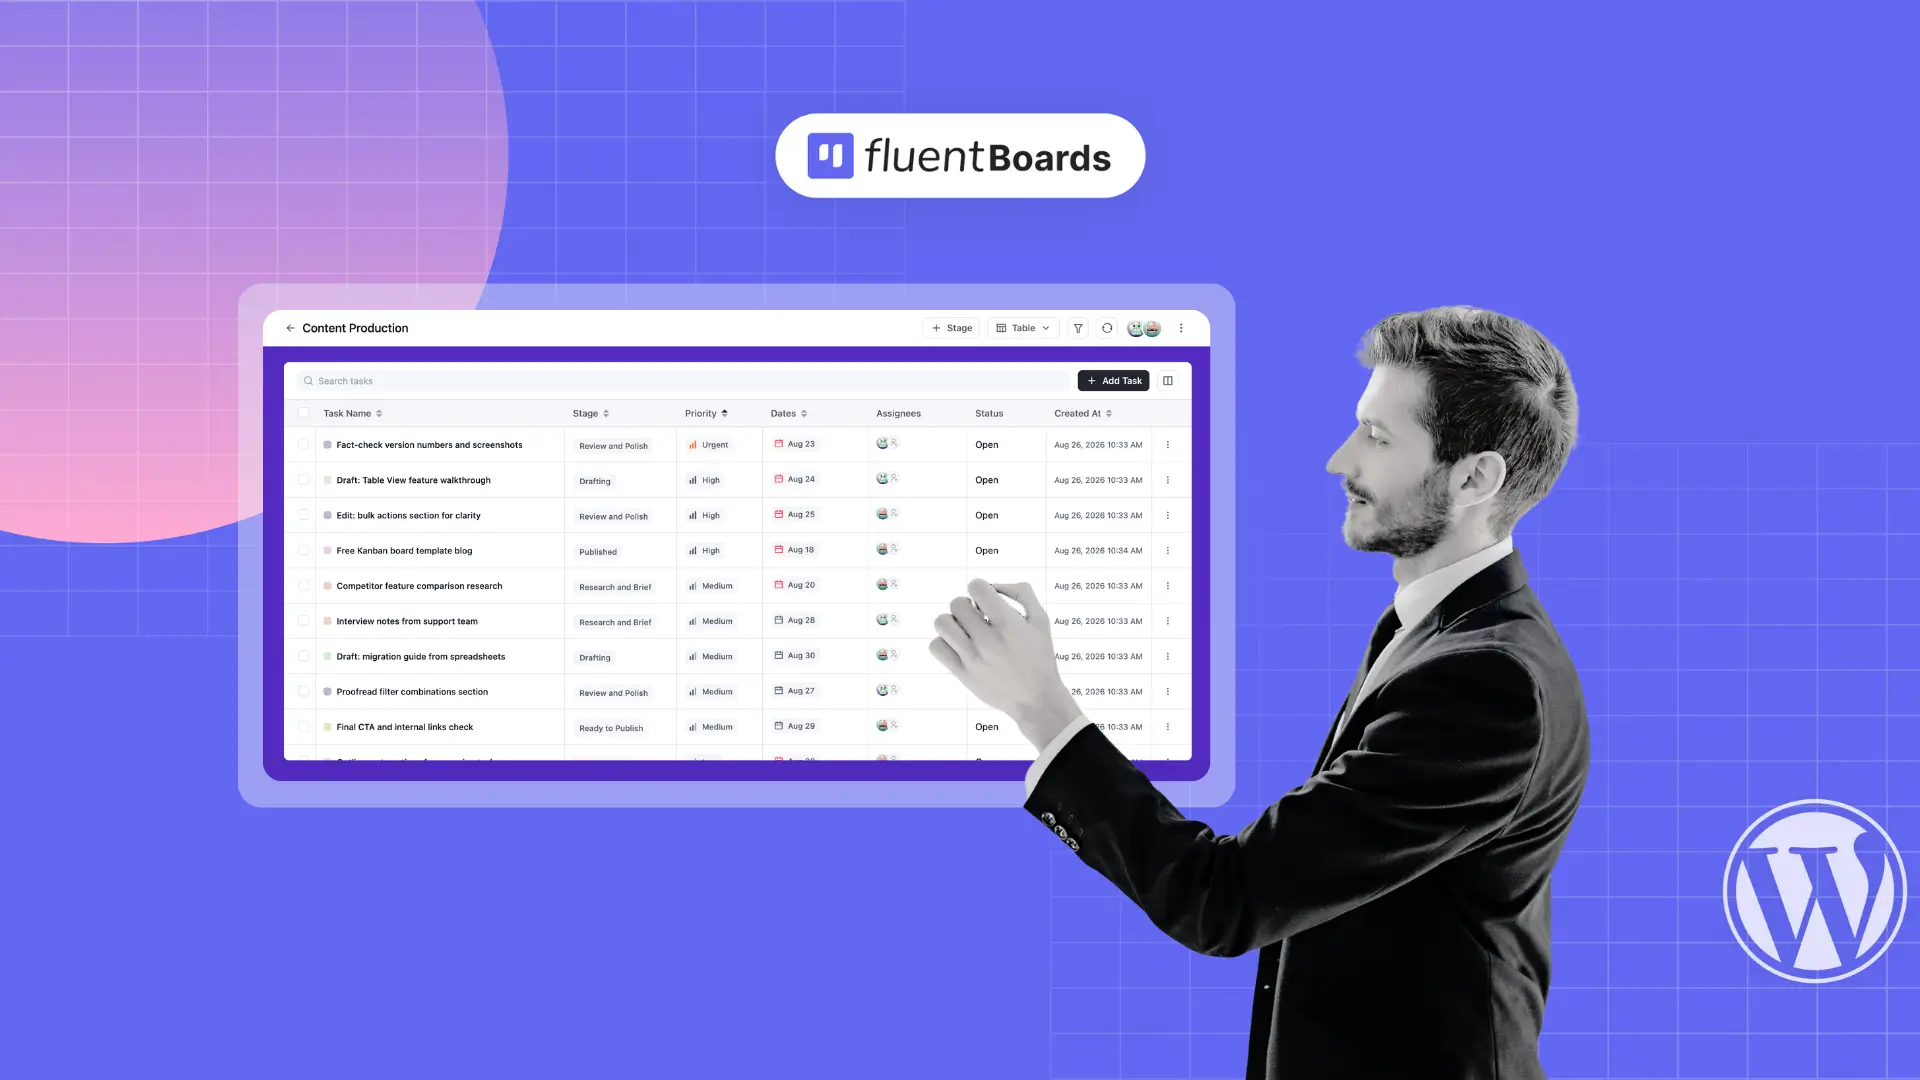
Table View in FluentBoards: Your Entire Project as One Sortable, Editable Spreadsheet


Some people never fully trusted Kanban.
You know this person. They ran projects in Excel before switching to a project management tool. They’re fine with Kanban day to day, but the moment someone asks for a status update, they want rows, columns, and sortable data.
Kanban can’t give them that. Scrolling through cards to build a picture of the whole project isn’t a reporting workflow.
Table View is built for exactly this:
- Every task becomes a row
- Every field becomes a column
- The whole project turns into one scrollable, sortable, filterable grid
All of it on the same board you already use. No separate tool, and no exporting your data before you can even start reading it.
Let’s get into it.
What the Table Layout Shows You
Switch to Table View from the “Table” dropdown in the board’s top navigation bar. The board reorganises instantly. Every task becomes a row, and the columns run across the top.
Eight columns show by default, and each one answers a different question:
| Column | What it tells you |
| Task Name | What the work actually is |
| Stage | Where it sits in the workflow |
| Priority | How urgent it is |
| Labels | What type of work it is |
| Dates | When it’s due, shown in red once the deadline has passed |
| Assignees | Who’s on it |
| Status | Whether it’s still open, closed, or archived |
| Created At | When the task was added, down to the minute |
That’s most of what you need to read a full project in one horizontal scan. One table, full project, with no toggling between cards and no clicking through stages.
Customizing Your Table Columns
The default columns are a starting point. Table View lets you choose exactly which columns appear.
Click the panel icon sitting just to the right of the black “Add Task” button, at the top right of the table. A “Table Columns” panel opens on the right side with a checkbox next to every column you can control:
- Priority
- Status
- Dates
- Assignees
- Labels
- Created At
- Subtasks, which shows how many subtasks are done out of the total
- Activity, which shows recent movement on the task
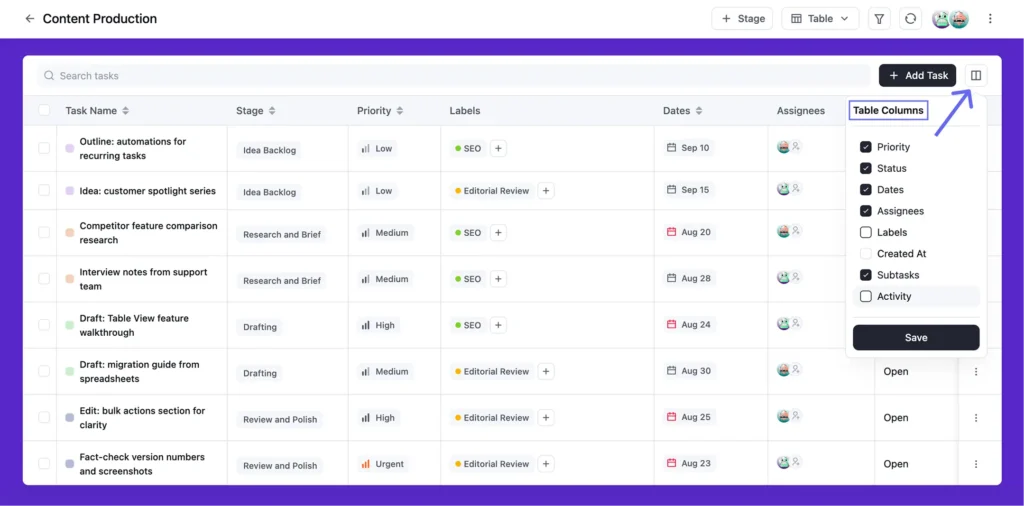
Subtasks and Activity are the two that aren’t on by default, so those are the ones to add when you want more depth. Task Name isn’t in the list because it can’t be switched off.
Toggle whatever you need, then click “Save”.
If you don’t need the Labels column on a particular board, remove it. If you want to track subtask counts or see creation dates alongside due dates, add those instead. The table adjusts to what actually matters on your project rather than handing you a generic template.
Inline Editing: Change Data Without Opening the Task
Click any cell in the table and you can edit it right there, with no task modal to open and nothing to wait for.
Click the Stage cell on a row and a “Change stage” dropdown opens, listing every stage on the board. Select a new one and it updates immediately. At the bottom of that dropdown sits a “Change Board” option, which moves the task to a completely different board, a cross-board move from a single inline click.
The other cells work the same way. Click Priority for the priority picker, click Dates to set or update a deadline, and click Assignees to add or remove team members. The Labels cell has a small “+” on it, so you can tag a task without leaving the row.
For end-of-sprint cleanup or mid-project reassignments, this is where Table View earns its place. You’re editing the project, not navigating it.
Pro Tip: Tick Set Reminder and pick one of six lead times: 30 minutes, 1 hour, 2 hours, 1 day, 2 days, or 1 week before the deadline. The assignee gets notified automatically, so nobody has to chase anybody. Match it to the work: a week for client deliverables, a day for internal drafts, 30 minutes for anything with a call attached.
More shortcuts in the row menu
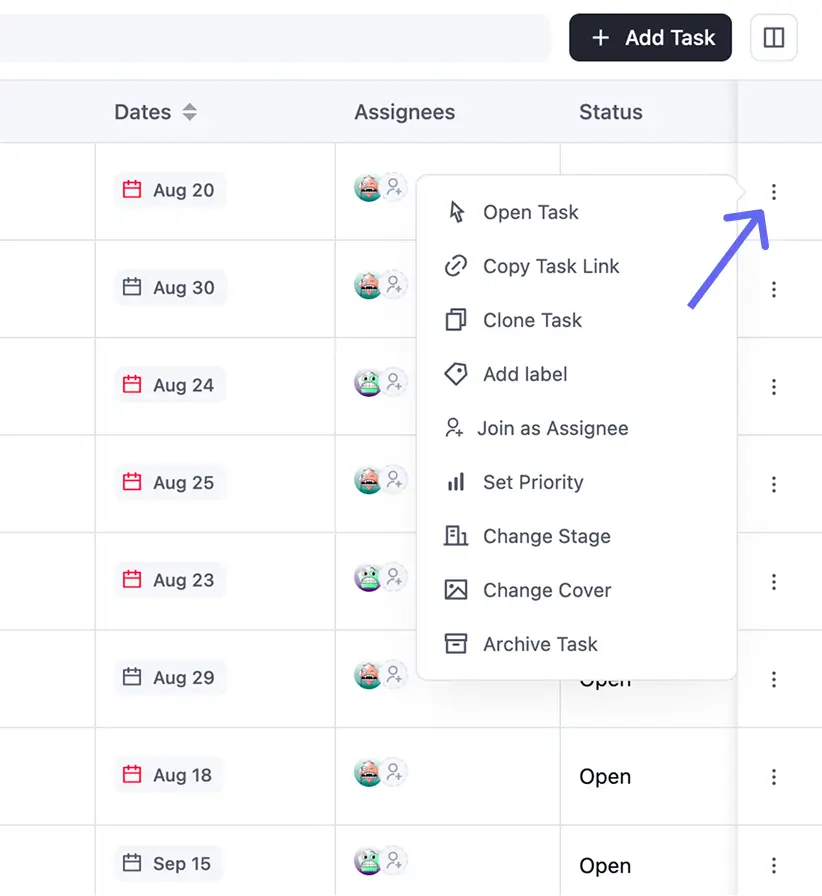
Every row has a “⋮” menu at the far right, packed with even more you can do without opening the task. Two of them are worth knowing straight away.
- Copy Task Link grabs a direct URL. Drop it into Slack or an email and your teammate lands on exactly the right task.
- Clone Task duplicates a task with all its fields intact. Perfect for work that repeats off-schedule, like a client onboarding sequence or a monthly report. Build it once, reuse it as often as you like.
You’ll also find Open Task, Add label, Join as Assignee, Set Priority, Change Stage, Change Cover, and Archive Task in there. However you prefer to work, it’s one click away.
Bulk Actions: Act on Multiple Tasks at Once
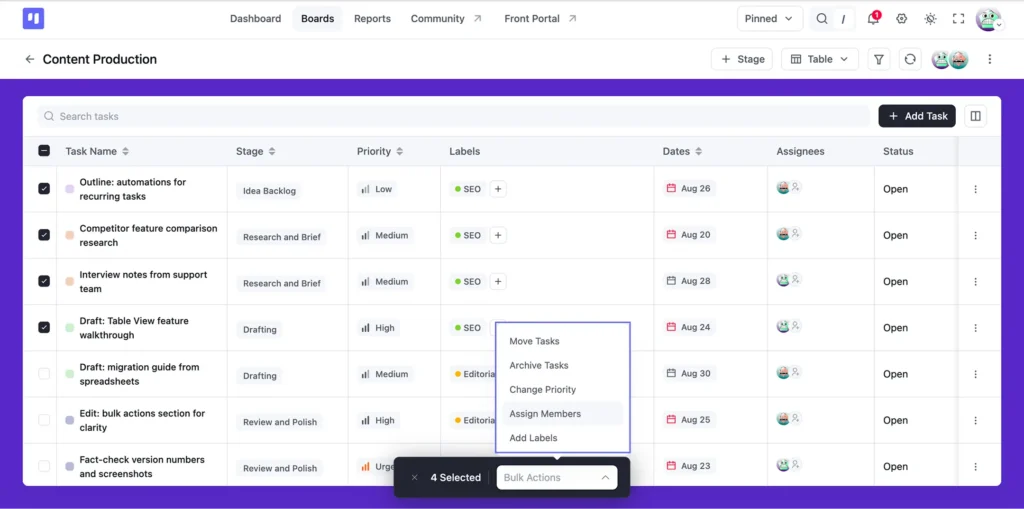
Select tasks by clicking the checkbox on each row. When two or more rows are selected, a “Bulk Actions” bar appears showing the count of selected tasks.
Click “Bulk Actions” to open the action menu. The options are Move Tasks, Archive Tasks, Change Priority, Assign Members, and Add Labels.
Move Tasks shifts your selection to a different stage or board. Archive Tasks clears them out of the active view in one go. Change Priority applies a new level across everything ticked, Assign Members adds a team member to all of it, and Add Labels tags the whole selection at once.
The workflow this really changed is end-of-sprint cleanup. Archiving completed tasks used to mean opening every single one. Now you tick everything sitting in “Published” or “Done” and archive the lot in one action.
Heads up: Archiving isn’t deleting. Open the board’s “⋮” menu at the top right, choose Archived Items, and everything you’ve archived sits under the Archived Tasks tab. Hover any task and a restore icon appears, click it to bring that one back. Tick several instead and a “Restore Selected” button shows up to bring them all back at once. Clear a finished sprint off the board and keep the full record.
Sorting and Filtering the Table
Every column header has a sort arrow. Click one to sort the table by that column, and click again to reverse the direction.
Three sorts do most of the work:
- Dates ascending gives you a clean chronological run from earliest deadline to latest
- Priority descending floats your highest-urgency work to the top
- Stage groups everything by where it sits in the workflow, without the visual separation of Kanban columns
Filtering works alongside sorting. The filter icon in the top navigation bar opens the filter panel, where you can narrow by:
- Assignees
- Stage
- Task Status
- Due Date
- Priority
- CRM Contacts
- Labels
- Custom Fields, if your board has any set up
Apply a filter and the table narrows to only the rows that match.
The filter combinations worth building
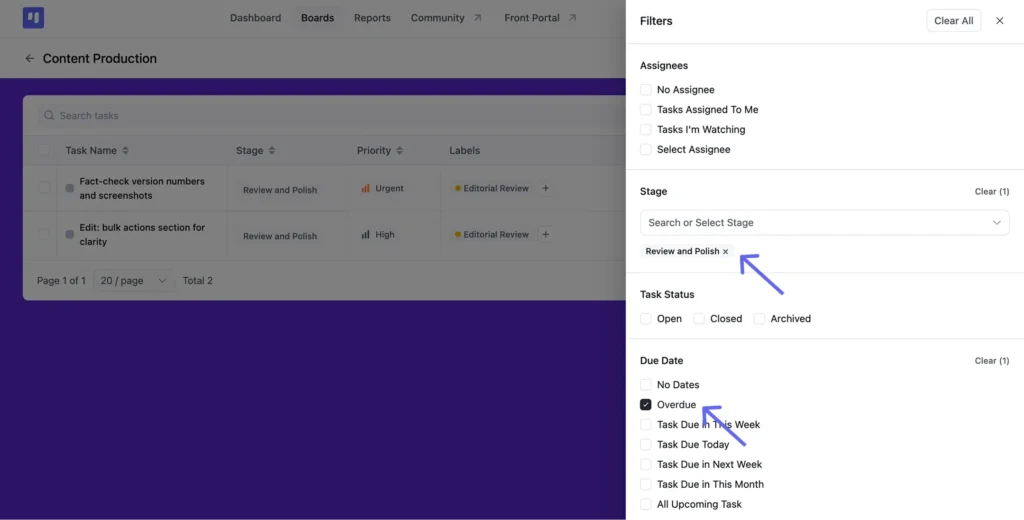
Sort by Dates ascending and filter to Overdue, and you have your immediate action list ranked by how late each task is, without hunting for any of it.
Filter to a specific assignee and sort by Priority descending, and you have that person’s work queue with the most urgent work at the top. It is the right view to open before a one-on-one.
Filter to a specific Stage and sort by Dates, and you can see exactly what is sitting in “Review and Polish” and how long it has been there. For tracking project management KPIs like cycle time or stage bottlenecks, that combination surfaces the data without any manual aggregation.
Adding Tasks from the Table
The “Add Task” button at the top right opens a task creation modal, so you can add work without leaving Table View, switching to Kanban, or losing the sort and filter you already set up.
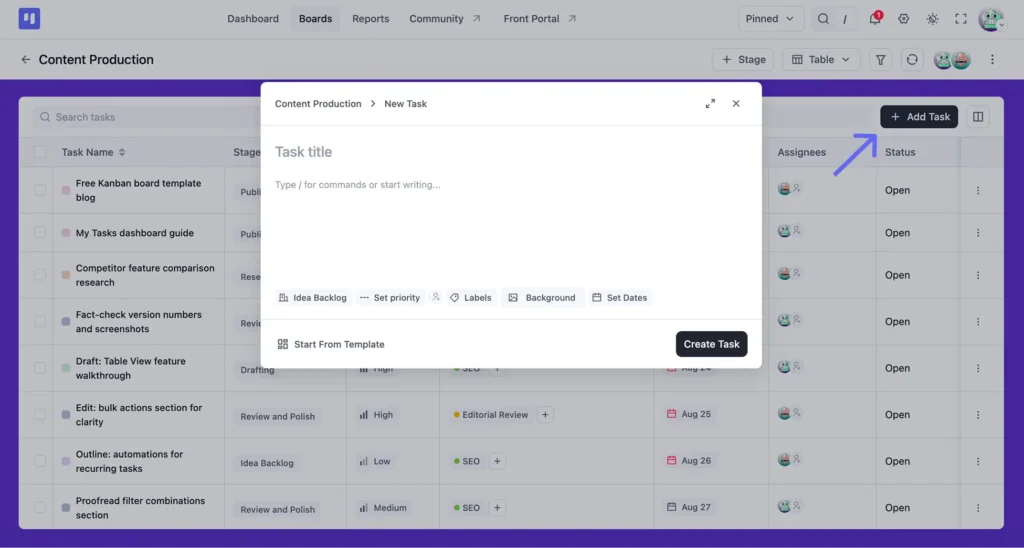
The new task appears as a row straight after creation. If you have a sort applied it slots into the right position on its own. If you have a filter applied and the new task does not match it, the row stays hidden until you clear the filter, which is exactly what should happen.
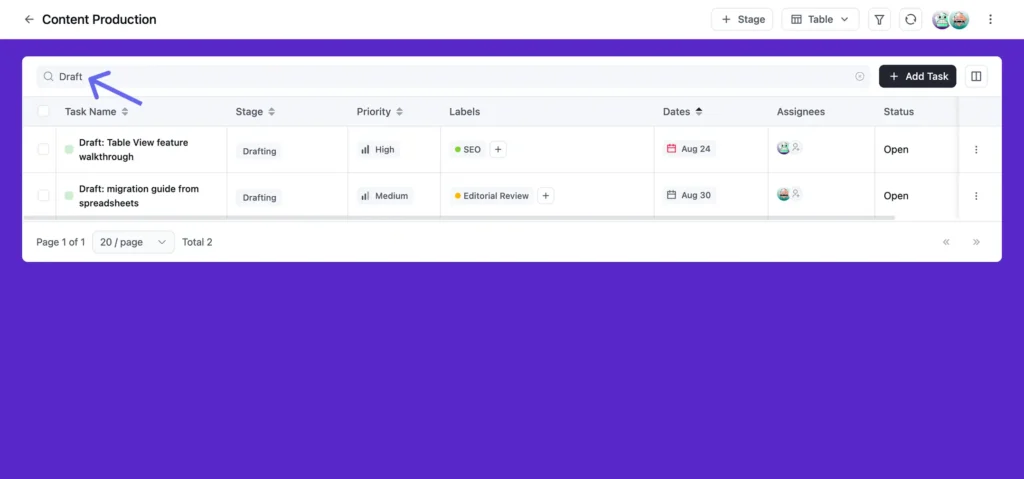
There is also a “Search tasks” bar at the top left, which searches across every task name as you type and narrows the visible rows live. Pair it with the filter panel and a crowded board comes down to the handful of rows you actually wanted.
Exporting the Table
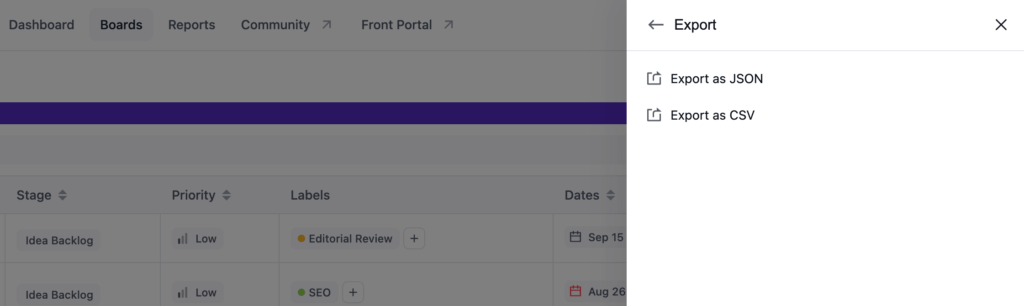
Open the board’s “⋮” menu and choose Export, and the whole board comes out in whichever format fits what you’re doing with it.
JSON carries the full picture: labels, assignees, dates, custom fields, and comments. That’s the one for backups, migrations, or handing your project data to another system.
CSV is the flat spreadsheet version, with stage, priority, status, dates, and custom fields laid out in columns. Open it straight in Excel or Google Sheets and it looks like the table you’ve been working in, with no nested data to untangle first.
This also answers the question the whole post raises. You don’t have to export anything to read your project, because Table View already gives you the spreadsheet layout right on the board. But when someone outside the board needs the file, it’s one click away, and your data was never locked in to begin with.
When Table View Is the Right Choice
Use Table View when you need to analyze or act on multiple tasks at once, not just move one task through a stage.
Project status reporting
When a stakeholder asks for a project status update, Table View is the fastest path to accurate data. Filter by stage, sort by due date, look at the Dates column for anything in red. That’s the real status of the project. The update that used to require opening and summarizing ten tasks now takes two minutes.
If you’re running an agency project workflow with regular client check-ins, Table View is where those reviews happen, on the board itself, not in a separate document you built by hand. For any team with a project management workflow that includes weekly reviews or internal reporting, same principle applies.
Onboarding a new team member
Table View is the right first view for a new hire stepping into a complex project. Show them the full table: every task, every owner, every stage, every deadline in a single scroll. That context is hard to get from Kanban, especially on a board with eight stages and 50 active tasks. Kanban board answers “what’s in each stage.” Table View answers “what is the project.”
For a full guide on onboarding a new team member using FluentBoards, that guide walks through the complete process.
End-of-sprint cleanup
At the end of a sprint or project phase, Table View plus bulk actions is the fastest way to close things out. Filter to “Closed” tasks or the “Published” stage, select all, archive. The board is clean for the next sprint in one action. What used to take individual task opens now takes a checkbox and one menu click
Frequently Asked Questions About Table View
Quick answers to what most people ask about Table View.
Is Table View available in FluentBoards Free?
No. Table View is a Pro feature. Free includes Kanban and List View, while Table, Calendar, and Gantt come with Pro. The free vs Pro comparison has the full breakdown.
Does exporting the table include labels and assignees?
Depends on the format. JSON includes everything, labels, assignees, dates, custom fields, comments. CSV is leaner: stage, priority, status, dates, and custom fields, but no labels or assignee columns.
Can a Viewer use Table View?
A Viewer can open Table View and see the data, but can’t edit inline, run bulk actions, or use the row menu’s action items. Those need Manager or Member access.
Do the changes I make in Table View show up in Kanban?
Yes. It’s the same board and the same tasks, just laid out differently. Change a stage in Table View and the card has already moved when you switch back.
Open Table View on Your Next Project Review
Table View is already sitting on every board. Switch to it from the “Table” dropdown in the board navigation.
Start with the default columns and sort by Dates. Anything in red is overdue. Open the filter panel, select “Overdue”, and there is your action list for the day. That is a full project health check, and you did not build a single thing to get it.
Then open the columns panel and add “Subtasks” and “Activity”. Now you can see depth and recent movement alongside the basics, which is the view you want for a project monitoring review. Not just what exists, but what is moving and what has gone quiet.
Your tasks are already in there. Your deadlines are already set. Your team is already assigned. Table View just stops making you click through it one card at a time.
Thanks for reading. The rows and columns you already trust are sitting inside the board you already use. You just have to switch the view.
Let’s redefine project management with FluentBoards!

Follow:


Get Tips, Tricks, & Updates
We won’t send you spam.




Add your first comment to this post