


12 Project Management KPIs That Matter (Formulas and Action Thresholds)


Most project dashboards are full of numbers nobody acts on. That is the real problem with KPIs. Not knowing which ones to track, and not knowing what number should make you stop and fix something.
This guide fixes both. You get twelve project management KPIs, the formula for each, and the exact signal that should trigger action. If you are not tracking anything yet, there is a short list of five to start with near the end.
What a KPI Actually Tells You
A KPI, or key performance indicator, is a number that shows whether a project is on track. The word “key” matters. A KPI is not any metric you can measure. It is one of the few that actually change a decision.
If a number has never once made you act differently, it is not a KPI. It is decoration. Keep that test in mind as you read, because half the metrics teams track fail it.
Quantitative vs Qualitative KPIs
Quantitative KPIs are hard numbers. Budget spent, tasks completed, days behind schedule. They are easy to measure and hard to argue with.
Qualitative KPIs measure things that resist a clean number, like stakeholder satisfaction or team morale. They take more effort to capture, usually through surveys or scores, but they often warn you of trouble before the hard numbers move.
A healthy project watches both. The quantitative side tells you what has happened. The qualitative side often tells you what is about to.
Leading vs Lagging KPIs
This is the split that separates a useful dashboard from a rear-view mirror.
A lagging KPI reports the past. Budget variance and schedule variance tell you where you already are. They are accurate but late.
A leading KPI hints at the future. A rising number of change requests, or a dropping milestone hit rate, warns you that trouble is coming while you can still do something about it.
Track only lagging KPIs and you will always be reacting. Add a few leading ones and you get the chance to steer.
The 12 KPIs, With Formula and Action Threshold
Here is the core of it. Each KPI, how to work it out, and the exact signal that should make you act. If you already track a slightly different set, keep yours. The point is the threshold column, not the exact twelve.
| # | KPI | Formula | Signal to Act On |
|---|---|---|---|
| 1 | Planned vs Actual Progress | Actual progress minus planned progress | More than 10 percent off plan, look into it this week |
| 2 | Task Completion Rate | Tasks done divided by tasks planned for the period | Below 80 percent of plan, something is blocking the team |
| 3 | Work in Progress | Count of tasks in progress at once | Above your set limit, you have a bottleneck, not momentum |
| 4 | Budget Variance | Budgeted cost minus actual cost | Negative and widening, you are overspending |
| 5 | Cost Performance Index | Earned value divided by actual cost | Below 1.0, every dollar is buying less than planned |
| 6 | Return on Investment | Net benefit divided by cost, times 100 | Trending below your target, question whether to continue |
| 7 | Schedule Variance | Earned value minus planned value | Negative, you are behind schedule |
| 8 | Schedule Performance Index | Earned value divided by planned value | Below 1.0, the timeline is slipping |
| 9 | Milestone Hit Rate | Milestones met on time divided by total milestones | Below 80 percent, your dates are optimistic, re-baseline |
| 10 | Change Request Rate | Change requests raised per period | Rising sharply, that is scope creep, not flexibility |
| 11 | Team Turnover Rate | Departures divided by average headcount, times 100 | Rising mid-project, capacity and morale are at risk |
| 12 | Stakeholder Satisfaction | Percent promoters minus percent detractors | Dropping between check-ins, trust is eroding, find out why |
A Quick Word on Earned Value
Four of those KPIs lean on earned value, so it is worth a plain-English pass.
Planned value is the value of the work you planned to have finished by now. Earned value is the value of the work you have actually finished. Actual cost is what you have spent to get there.
From those three, you get the two most trusted health checks in project management. Cost Performance Index tells you if you are getting your money’s worth. Schedule Performance Index tells you if you are keeping pace. In both, 1.0 means on plan, below 1.0 is a problem, and above 1.0 means you are ahead.
You do not need a finance degree to use them. You need the three inputs and a calculator.
The 5 KPIs to Start With
You do not need all twelve. Tracking everything creates reporting noise and slows you down. If you are starting from nothing, track these five.
Task completion rate tells you whether work is actually moving. Milestone hit rate tells you whether your dates are real. Budget variance tells you whether the money is on track. Schedule Performance Index tells you whether time is on track. Change request rate warns you about scope creep before it buries the plan.
Master those five. Add the rest only when a specific question needs an answer. A KPI you check but never act on is just more to read.
Vanity Metrics to Ignore
Some numbers feel productive and tell you nothing.
Raw task count rewards busywork, not progress. A team can close fifty tiny tasks and move the project nowhere. Hours logged means little without output attached to it. And any metric nobody ever acts on is there for comfort, not control.
Cutting these is not laziness. It is focus. Every number on your dashboard should earn its place by changing what you do.
How to Track These Without Rebuilding a Spreadsheet Every Week
The reason most teams abandon KPIs is effort. Pulling numbers into a spreadsheet by hand every week gets old fast, so it quietly stops happening.
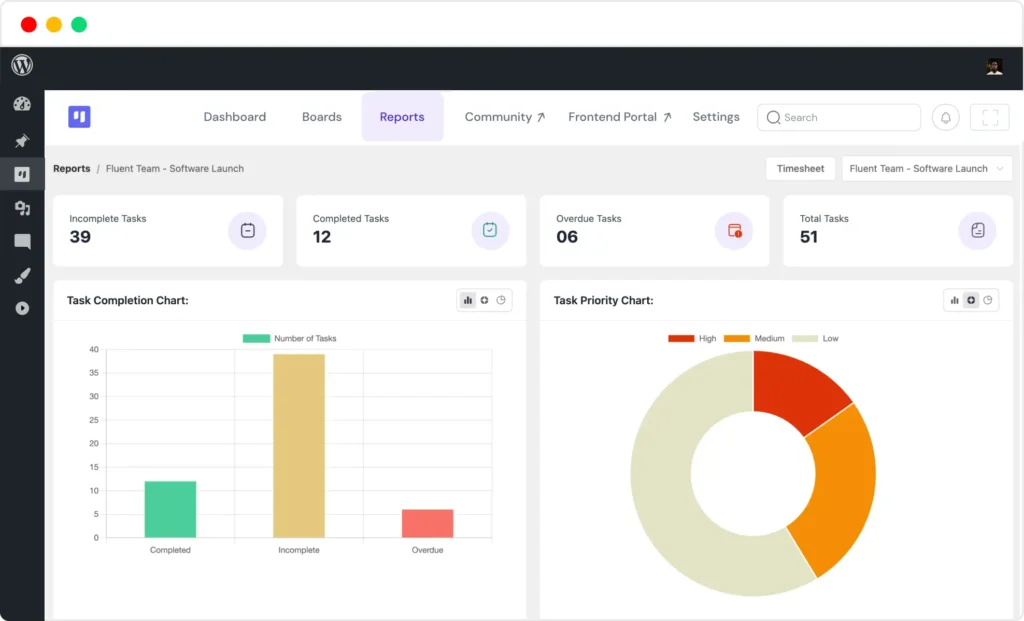
Keeping the work and the reporting in one place removes that friction. If your team runs projects inside WordPress, FluentBoards shows task completion and overdue work in its reporting view, so the numbers update as the team works rather than at the end of a manual chase.
Frequently Asked Questions
How many KPIs should a small team track?
Three to five is plenty to start. Task completion rate, milestone hit rate, budget variance, Schedule Performance Index, and change request rate cover most of what a small team needs. Add more only when a real question calls for it.
What is the difference between a leading and a lagging KPI?
A lagging KPI reports what has already happened, like budget variance. A leading KPI hints at what is coming, like a rising change request rate. You want both, but leading KPIs are the ones that let you act in time.
What is a good CPI or SPI value?
For both, 1.0 means you are exactly on plan. Below 1.0 is a warning: below 1.0 on CPI means you are over budget, and below 1.0 on SPI means you are behind schedule. Above 1.0 means you are ahead.
Pick Five, Set Thresholds, Then Act
The teams that get value from KPIs are not the ones tracking the most. They are the ones tracking a few, with a clear line for when to act, and the discipline to actually act when a number crosses it.
Start with the five above. Give each one a threshold. Watch milestone hit rate closely, because it is the earliest honest signal that your dates are slipping. Keep an eye on the numbers as you monitor the project through delivery, and tie every KPI back to your project objectives so you are measuring what actually matters.
A number that never changes a decision is not worth tracking. Everything on this list can, if you let it.
Let’s redefine project management with FluentBoards!

Follow:


Get Tips, Tricks, & Updates
We won’t send you spam.





Leave a Reply