

Table View for Project Management: The Ultimate Way to Manage Project Data


Your project data is everywhere.
Statuses, deadlines, assignees, priorities. All buried inside individual cards.
And when your stakeholder asks for a quick update, you are not ready.
Not because the data does not exist. Because without the right view, scattered data is nearly impossible to read at a glance.
So you go hunting.
- Open a card
- Check another
- Cross-reference a third
By the time you have the full picture, ten minutes are gone.
That cycle does not stop on its own.
Well, there is a view built exactly for this moment. A view where you can quick scan your entire project data. All of it. At once. In one clean grid.
That is table view.
So let us walk through how you can actually use it to manage your project data without losing time.
What Is Table View in Project Management?
Table view is a grid-based layout that organizes your project tasks into rows and columns, giving you a clear, scannable view of your data.
Each row represents a task. And each column captures a key detail, for example:
- Title
- Stage
- Priority
- Status
- Due date
- Assignee
So instead of moving cards across a board, you scan rows across a screen.
Unlike a spreadsheet, the table view stays connected to your live project data. When a task updates, the view reflects it instantly.
No manual entry. No separate document to maintain.
That makes it the go-to view when you need to sort, filter, and review your entire project without missing important details.
Why Every Project Team Needs a Table View for Project Data
Managing project data sounds simple until the project actually grows. That is when the cracks start showing.
Here is where most teams struggle:
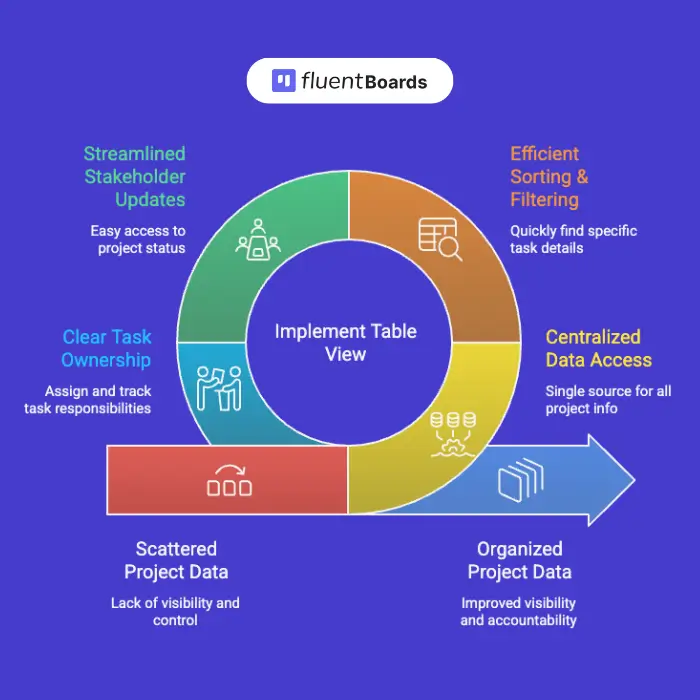
1. Too many tasks, not enough visibility
As a project scales, getting a clear picture of what is actually happening means clicking through card after card until you finally piece it together. By then, something has already slipped.
2. Sorting and filtering takes longer than it should
The data exists somewhere across your board. But finding which tasks are overdue, unassigned, or high priority without a structured view means a manual search every single time.
3. Stakeholder updates eat time you never have
Your project stakeholders need a clear picture of where things stand. But pulling that information together from individual cards before every update takes longer than the update itself.
4. Ownership gets harder to track as the team grows
When project teams scale, accountability quietly slips. Tasks get created without owners. Work sits in stages with no one responsible. And by the time the gap surfaces, the delay has already started.
5. Project data ends up scattered across too many tools
A spreadsheet for tracking. A board for tasks. Email for updates. Every switch costs time. And every tool is one more place where information lives out of sync with everything else.
How to Manage Project Data Using Table View (Step by Step)
Here is how to use table view to manage your project data from start to finish. Plus, setting this up takes less time than you think.
Here is the full walkthrough-
Note: In the following steps, we’ll use FluentBoards to demonstrate how table view helps you structure, track, and control your project data directly within your workflow.
Step 1: Switch to table view on your board
Your board is open. Tasks are running across stages. But right now you do not need to see them moving. You need to read them.
So click the view toggle at the top right of your board and select Table.
One click. That is it.
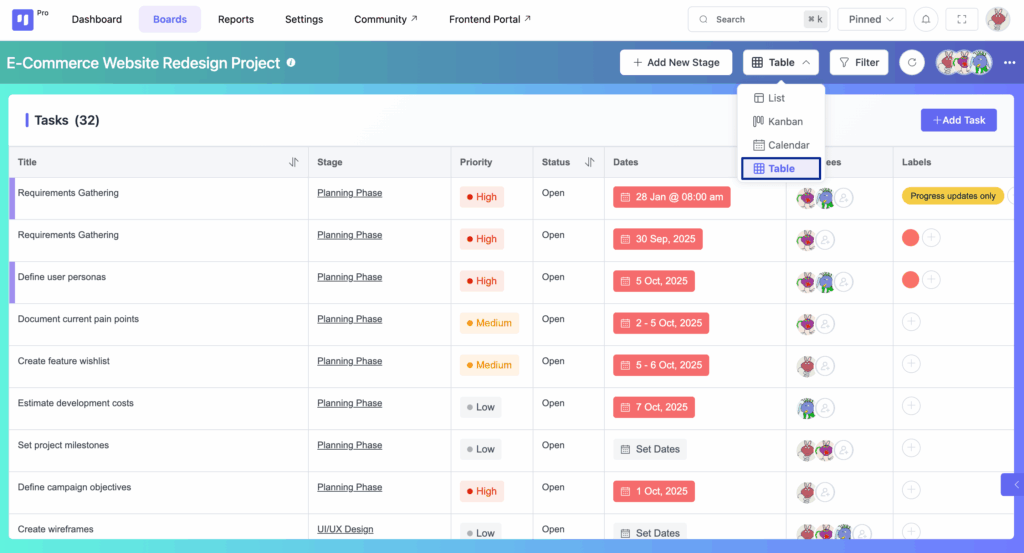
Your tasks instantly reorganize into rows. Every detail lines up across columns. Nothing changes about your project, only how you are looking at it.
Note: You did not rebuild anything. Your tasks, stages, priorities, and assignees are exactly where you left them. Table view just changes the lens, and your whole project is readable in one scan.
Step 2: Read your entire project in one scan
Now look at what is in front of you.
Every task has a row. Every column answers one question you ask yourself every single day:
- Title: what is the task?
- Stage: where does it sit right now?
- Priority: how urgent is it?
- Status: is it open or closed?
- Dates: is it on track or already late?
- Assignees: who owns it?
- Labels: how is it categorized?
And here is where it gets useful fast.
Overdue dates are highlighted automatically. Priority levels are color coded so High tasks are impossible to miss.
Step into the Future of Project Management!
Plus, tasks with no deadlines set show “Set Dates” right in the column. Empty assignee slots stand out immediately.
So before any meeting, before any update, you already know:
- What needs action today
- What is falling behind
- What is missing ownership
- What has not been properly scheduled
You do not need to open anything, your project data is already telling you what matters.
Pro tip: Open table view at the start of the week. You know your project status before your first coffee.
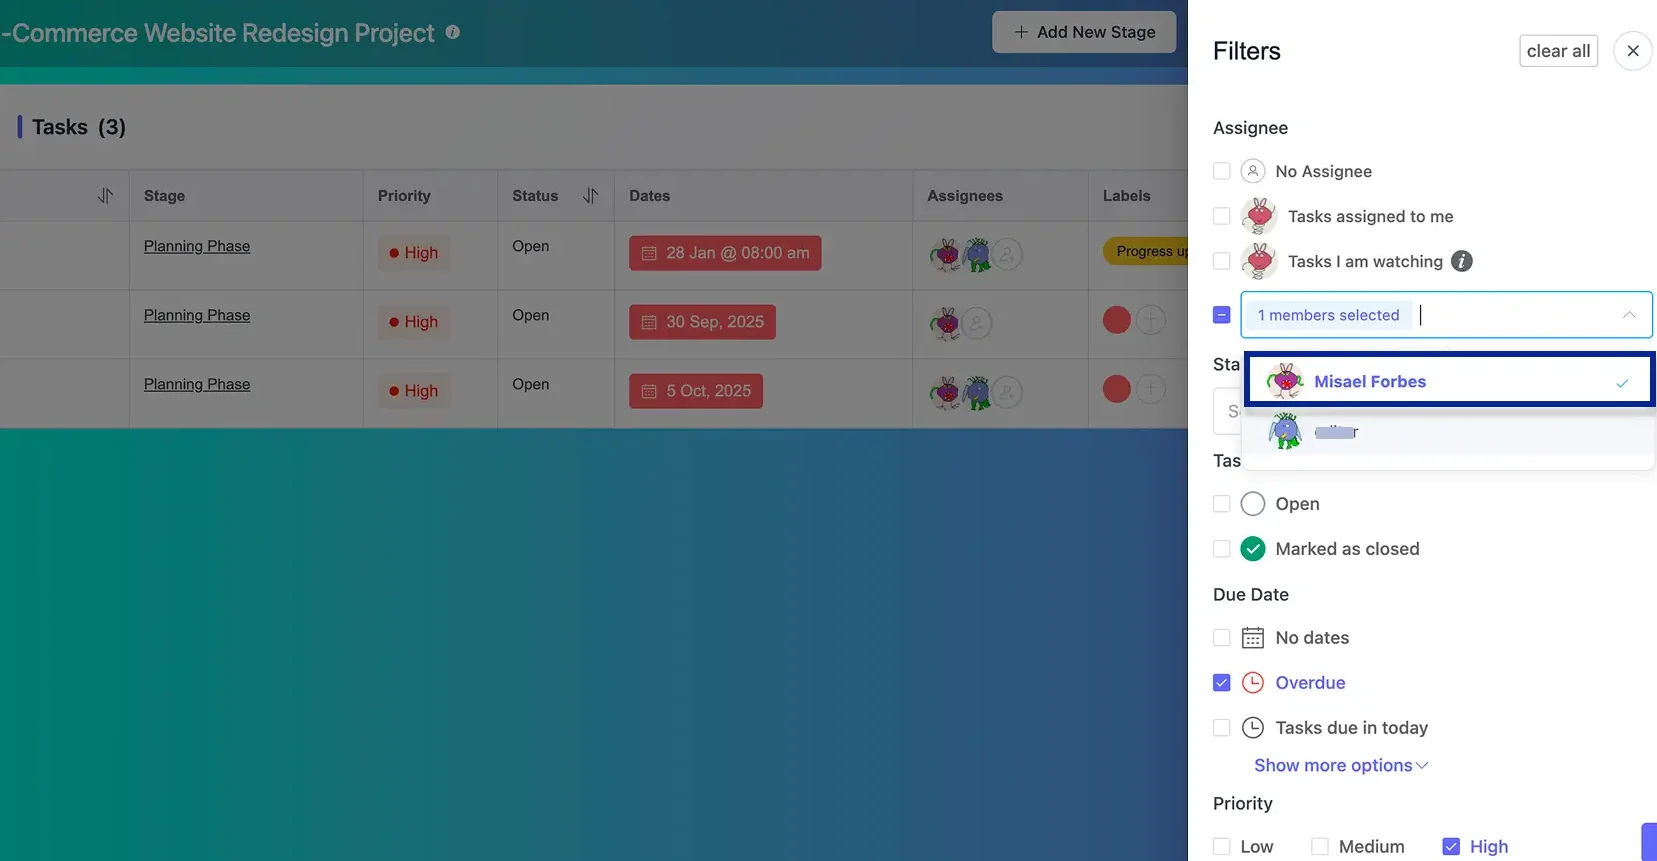
Step 3: Filter your data to find what you need
Here is where most managers waste time. They scroll through the full board looking for overdue tasks, unassigned work, or high priority items sitting open.
Table view has a Filter button at the top right. Click it.
Now filter by:
- Overdue to see every late task instantly
- Assignee to check one person’s full workload before adding more to their plate
- Priority High + Status Open to find what needs immediate action today
- Labels to focus on specific categories of work
The irrelevant rows disappear. What is left is exactly what you need to act on, without the noise.
And when your project has dependencies, filter by Stage to check if a task needs to finish before the next one can start. You see the blocker before it becomes a delay.
Why this matters: Instead of mentally sorting through everything, the filter does it in two clicks. You act faster because you find faster.
Step 4: Manage task data without leaving the table
You spotted a task in the wrong stage. Or a task with no due date that should have had one a week ago.
In table view, you handle it right there without losing your place.
From the three dot menu on any task row:
- Change the stage so your project workflow reflects where work actually stands
- Update priority so your data shows what matters right now
- Assign or reassign members so ownership is always clear
- Apply a label so your tasks stay organized as work evolves
Also, if a deadline needs updating, click Set Dates from the Dates column. Pick the date, set the time, save.
Bonus: While setting dates, you can also add a reminder so you get notified before the deadline hits. One less thing to keep track of manually.
So instead of reviewing data first and updating it later, you manage everything in real time. Your project data stays accurate, structured, and reliable.
Step 5: Open a task only when you need the full detail
Your table shows every column at a glance. But managing project data sometimes means going one level deeper.
You may need to check a subtask group, respond to a comment, or update a custom field your team depends on before the next step can start.
Here is what you do. Click the task title from any row. The full card opens right beside your table without pulling you away from your work.
From here, you can:
- Description to add context, define scope, and give your team everything they need before work starts
- Subtasks to track exactly what is done and what is pending
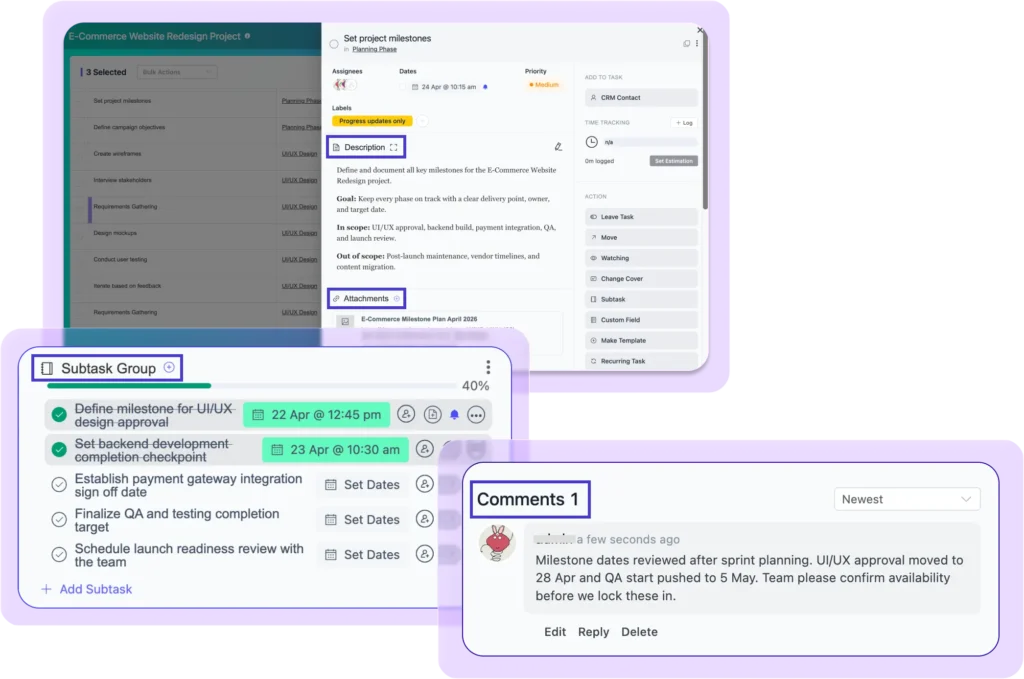
- Comments for real time communication in context
- Custom fields for the specific data points your project runs on
- Time tracking to keep hours accurate against your estimates
- Attachments and links to keep all supporting files connected to the task
Of course, once you close the card, you are back in the table exactly where you left off. Every update you just made is already reflected in your view.
Step 6: Update multiple tasks in one move
When one task needs updating, you handle it from the row.
But when scope shifts and five tasks need the same change at once, that is where the checkbox column comes in.
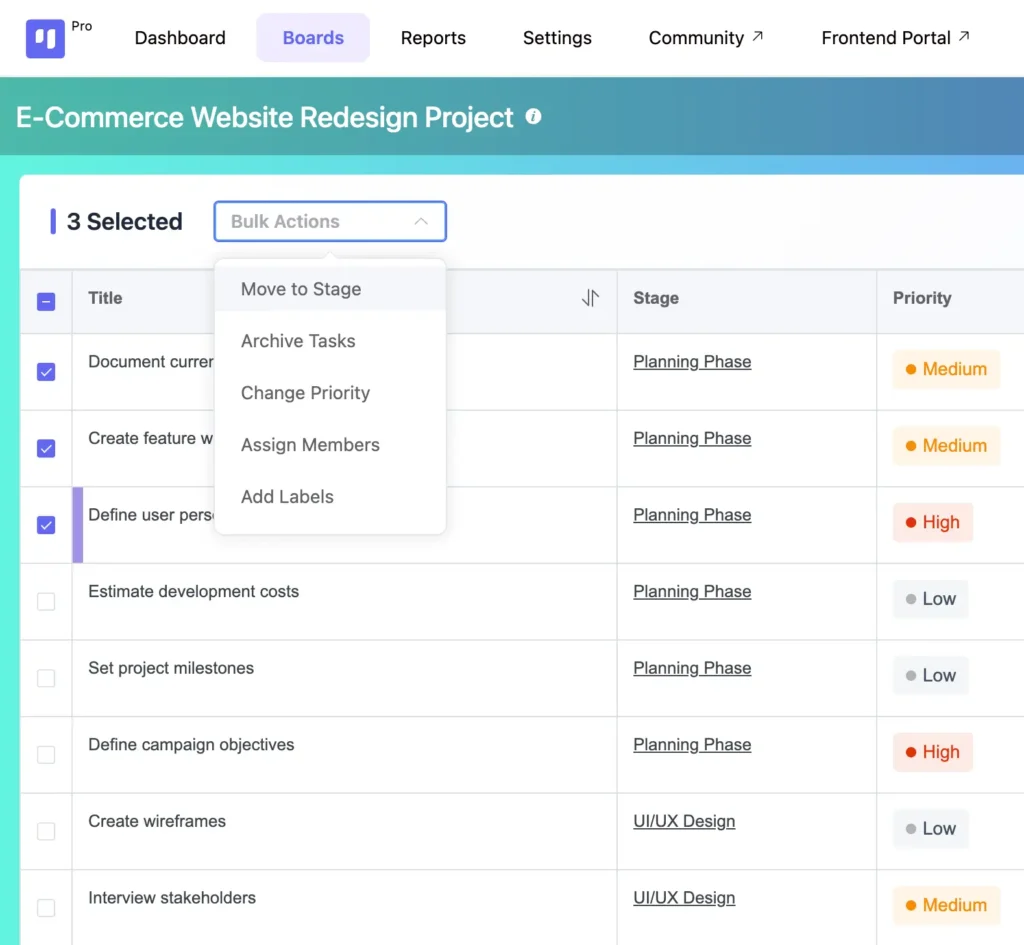
Select all affected tasks from the left. The action menu appears at the top. From there:
- Move all selected tasks to a new stage at once
- Change priority across all of them in one click
- Assign or reassign members together
- Archive tasks that are no longer relevant in one go
- Add labels in one action
Thirty seconds. Done. Back to the table.
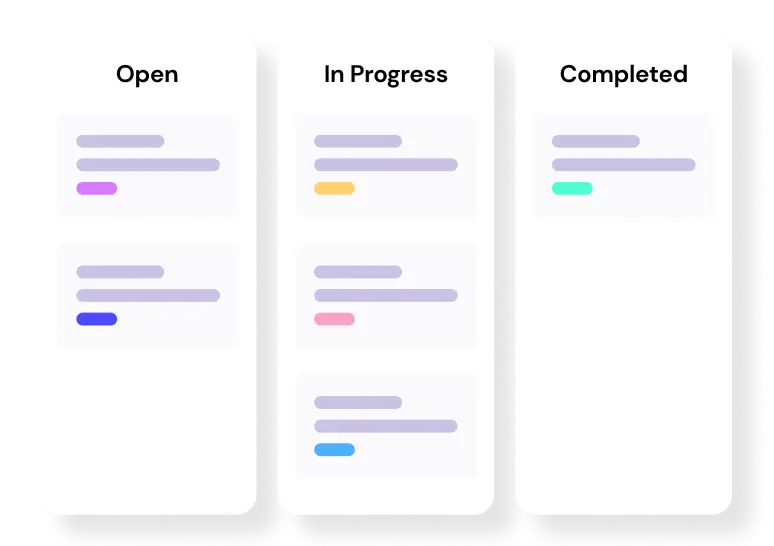
Table View vs Kanban View: Two Ways to See the Same Project
Both views show the same tasks. Both live inside the same board. But they answer completely different questions.
Here is the difference:
| Aspect | Table View | Kanban View |
| Best for | Reading and acting on data | Tracking workflow and movement |
| Shows | All task details in one grid | Tasks moving across stages |
| Use when | You need to filter, sort, update | You need to see work in progress |
| Strength | Data clarity and bulk actions | Visual flow and bottleneck spotting |
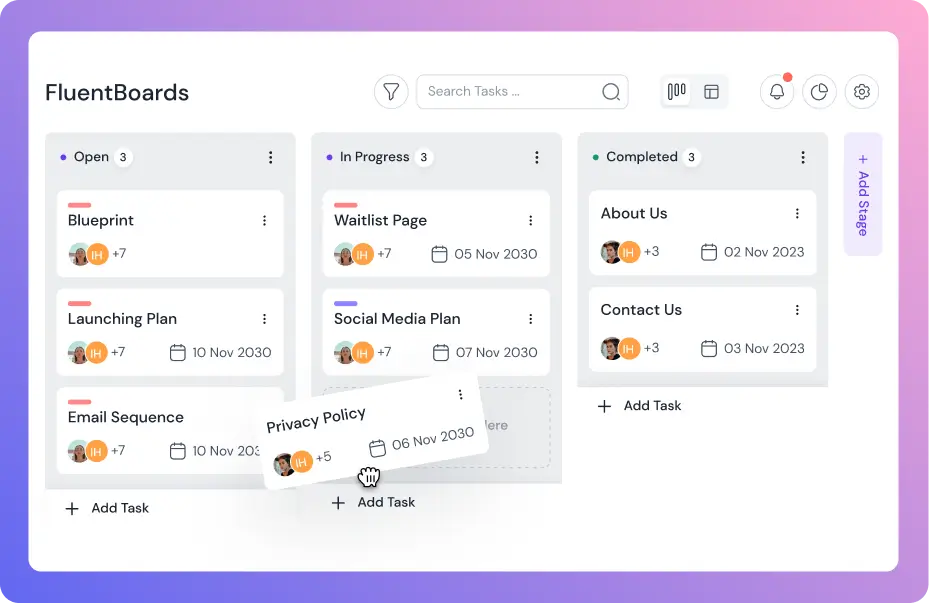
So the question is not which one to use. It is knowing when to switch.
Use Kanban when you want to see tasks moving through stages. Switch to table view when you need to read your project data and act on it fast.
Neither replaces the other. Together they give you complete control.
Want to see how Kanban handles workflow? Read: Kanban board for project management
Level up your project management game inside WordPress – where limitless possibilities come at an unbeatable price!
Common Table View Mistakes in Project Management (and How to Fix Them)
Table view is simple to use. But a few habits quietly make it less useful than it should be.
- Not setting due dates makes the Overdue filter useless when you need it most. Set dates on every task the moment you create it.
- Scrolling through tasks manually defeats the purpose of table view. Click Filter and let the view do the sorting.
- Opening cards to check information already visible in the columns wastes time. Trust the view and open a card only when you need the full detail.
- Updating tasks one by one is the most common time drain. Use the checkbox column, select all affected tasks, and run one bulk action to update everything at once.
- Using table view only for reading leaves its best features untouched. Move tasks, set dates, reassign, and archive directly from the view.
- Skipping the Assignee column before adding new work quietly overloads your team. Filter by Assignee first so every decision is based on actual workload.
- Not using table view for Project monitoring means problems surface later than they should. Filter by Overdue and Priority High daily and you catch what is slipping before it becomes a delay.
Start Managing Your Project Data with Clarity
Your tasks exist. Your deadlines are set. Your team is assigned.
But if reading that data still means clicking through cards one by one, the problem is not your project. It is your view.
Table view puts everything in one grid so you can scan, act, and move on. No hunting. No context switching. No separate spreadsheet to maintain.
Switch the view. Manage the data. Get back to work.
Thanks for reading this far. Wishing you all the best on your project management journey!
Let’s redefine project management with FluentBoards!

Follow:
Get Tips, Tricks, & Updates
We won’t send you spam.


Leave a Reply