FluentBoards provides a detailed report of your tasks, allowing you to understand overall task progress and view a summary in one place, making project management simpler and more understandable. In this article, we provide a brief overview of the Reports feature in FluentBoards.
Reports #
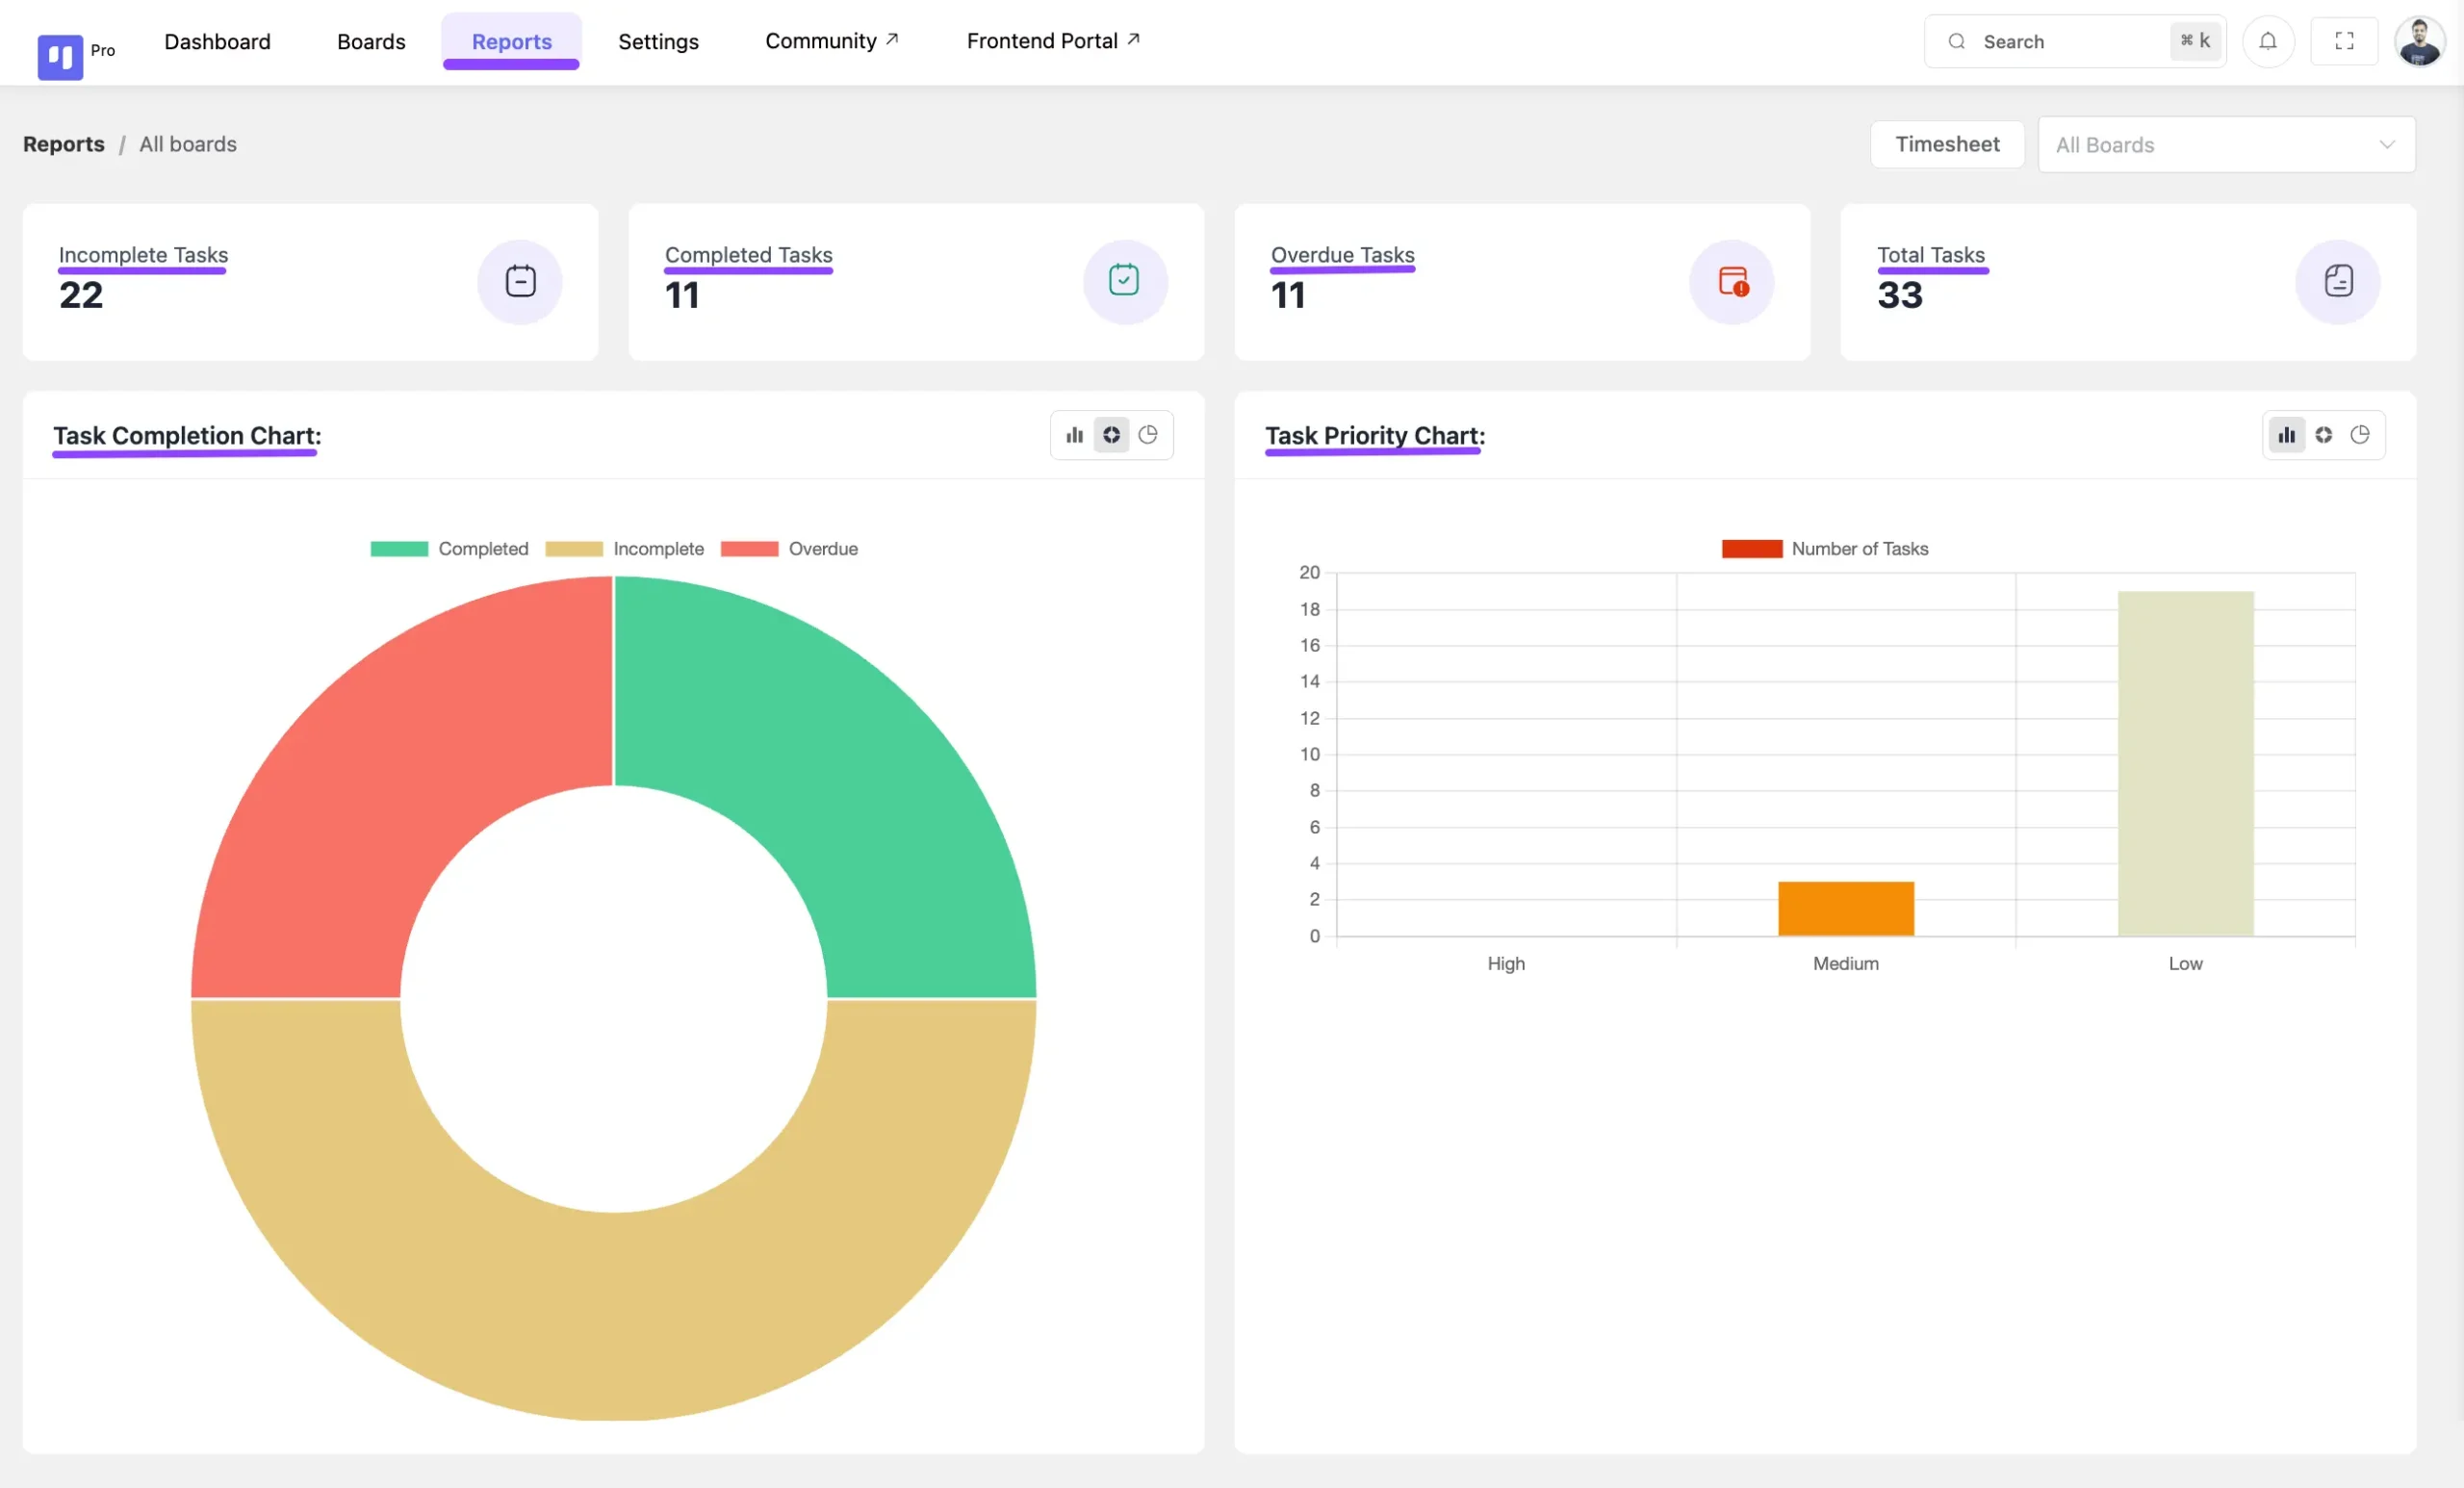
To access the report in FluentBoards, go to FluentBoards and click on Reports from the navbar. You will be directed to the Reports page, which includes the following sections:
- Incomplete Task: Displays all incomplete tasks.
- Completed Task: Shows reports of completed tasks.
- Overdue Task: Lists tasks past their deadlines.
- Total Task: Indicates the total number of tasks on your board.
- Task Completion Chart: Visual graph of completed tasks with three types of charts (Bar, Pie, and Donut chart).
- Task Priority Chart: Visual graph displaying task priorities.

Board and Stage Selection #
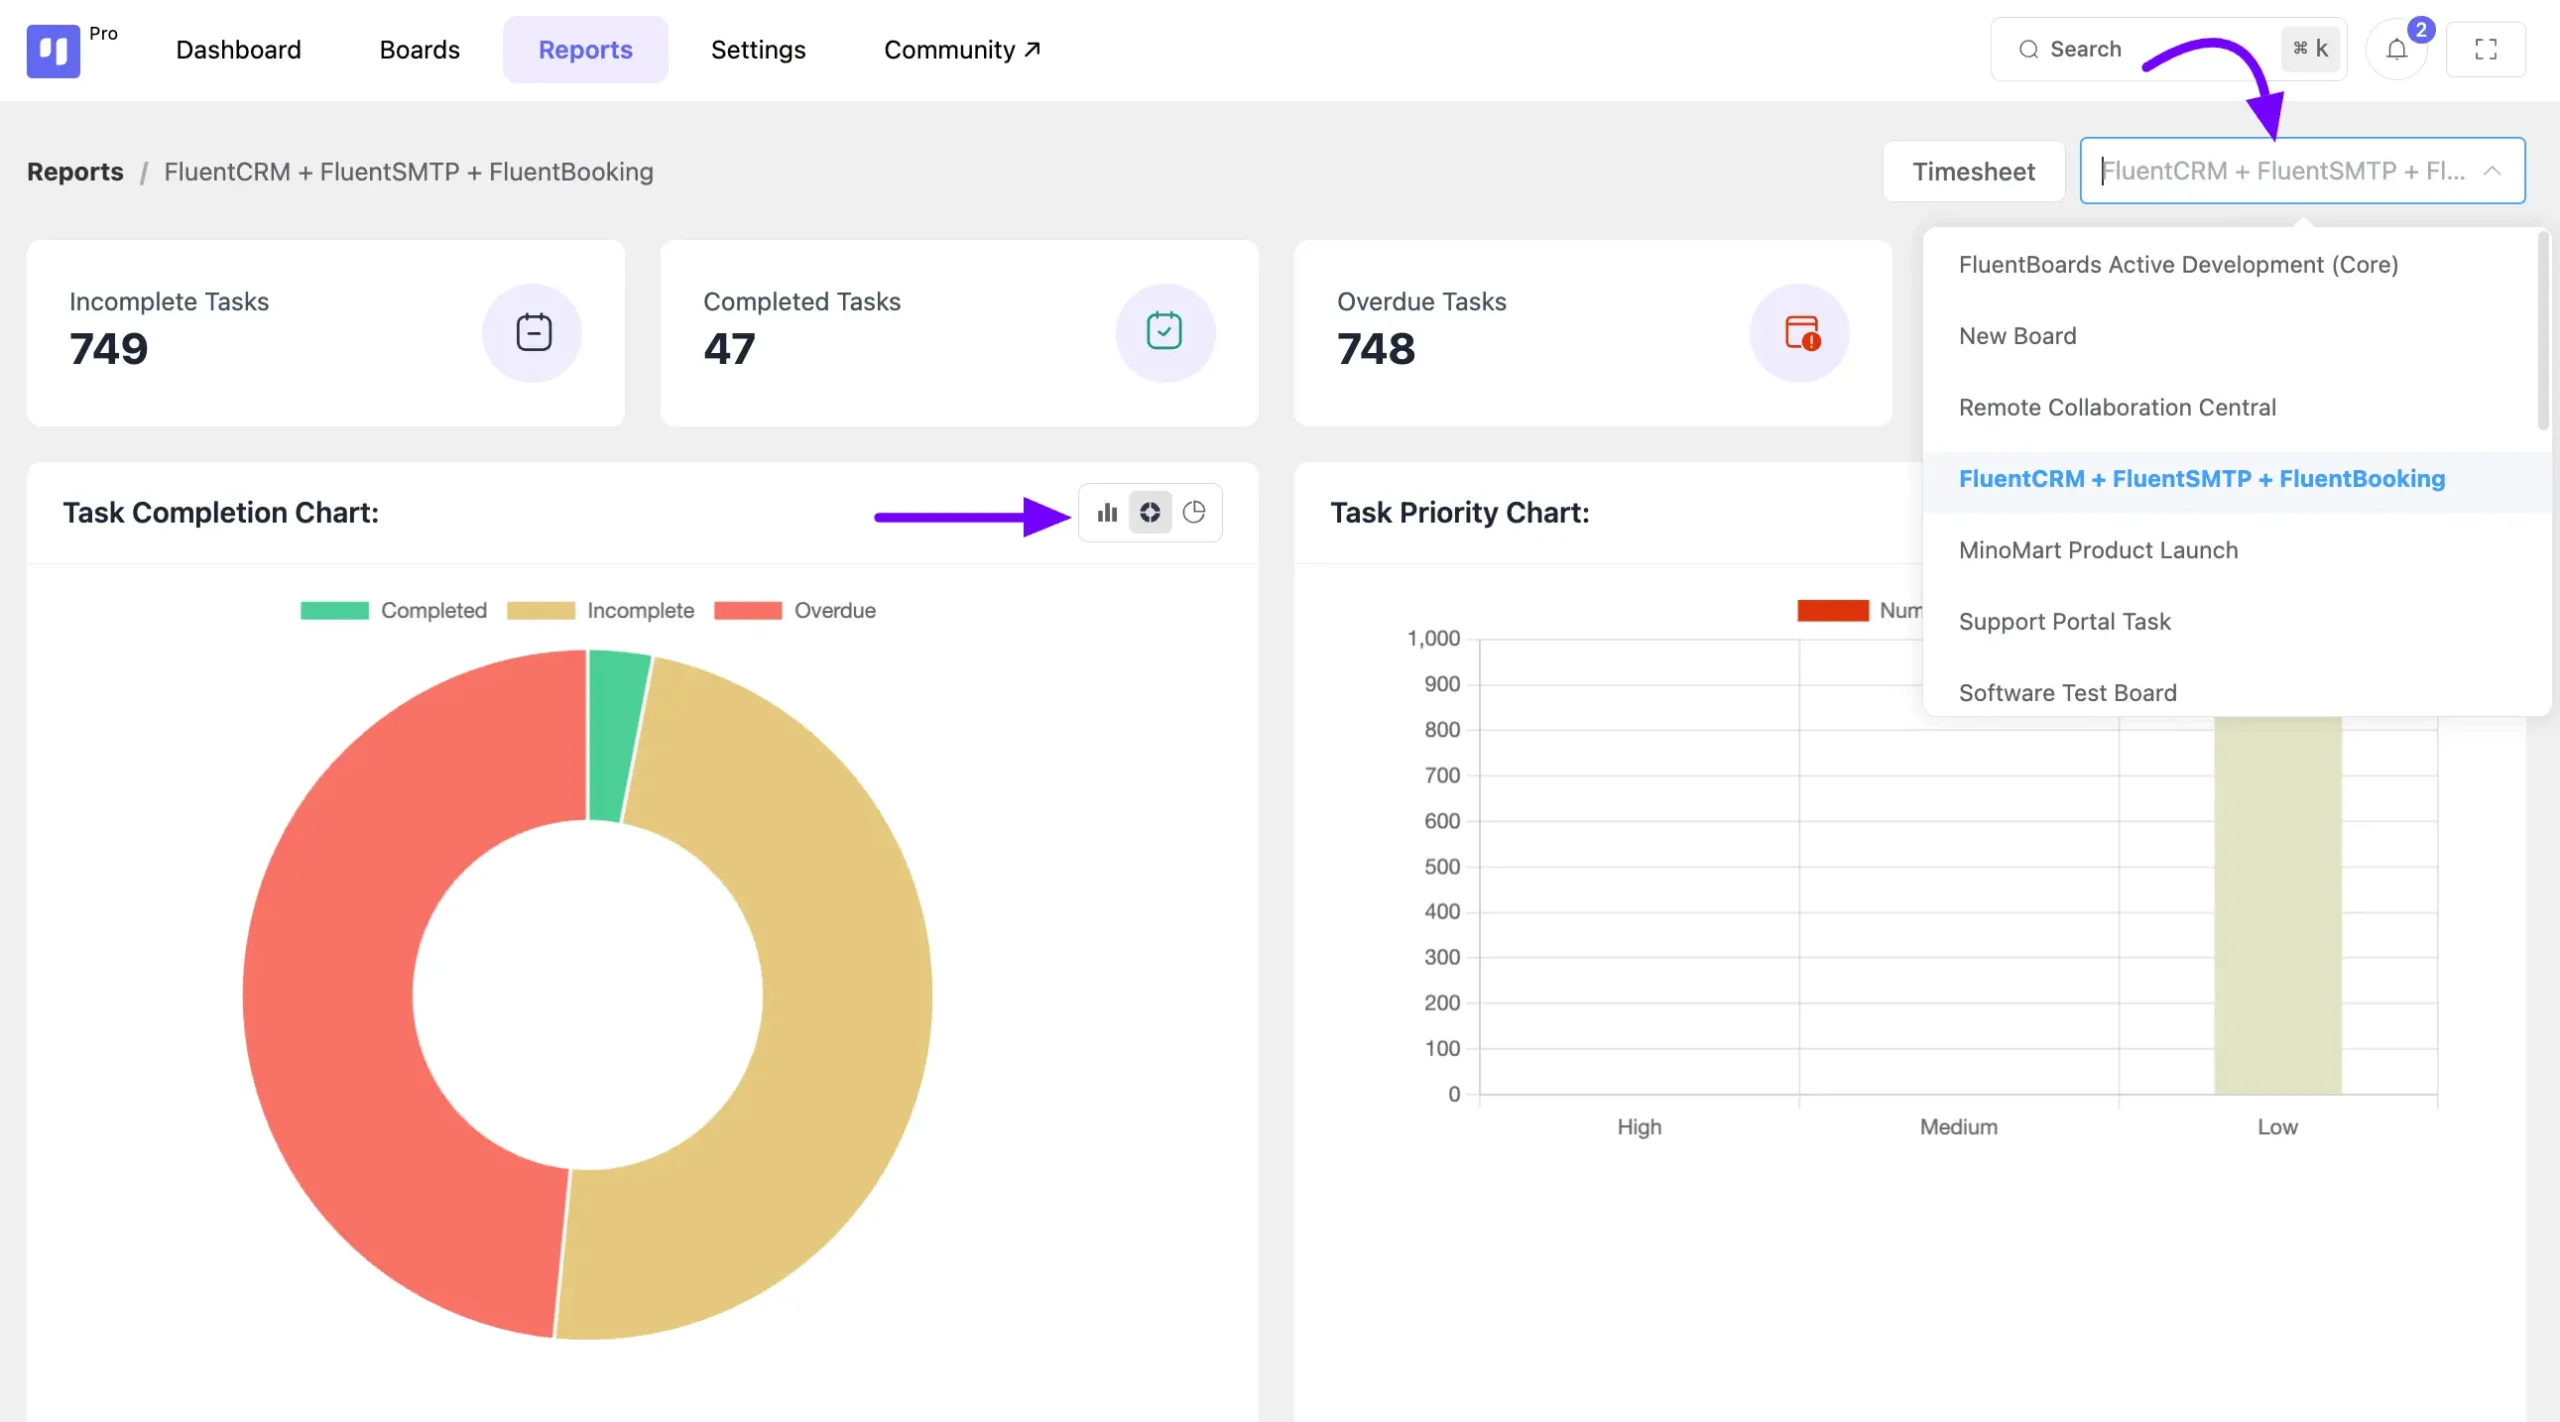
In the task report section, you’ll find a dropdown field on the top right to select specific Boards to display their reports.
The report sections feature three types of visual graphs: Bar, Pie, and Donut charts.

Timesheet #
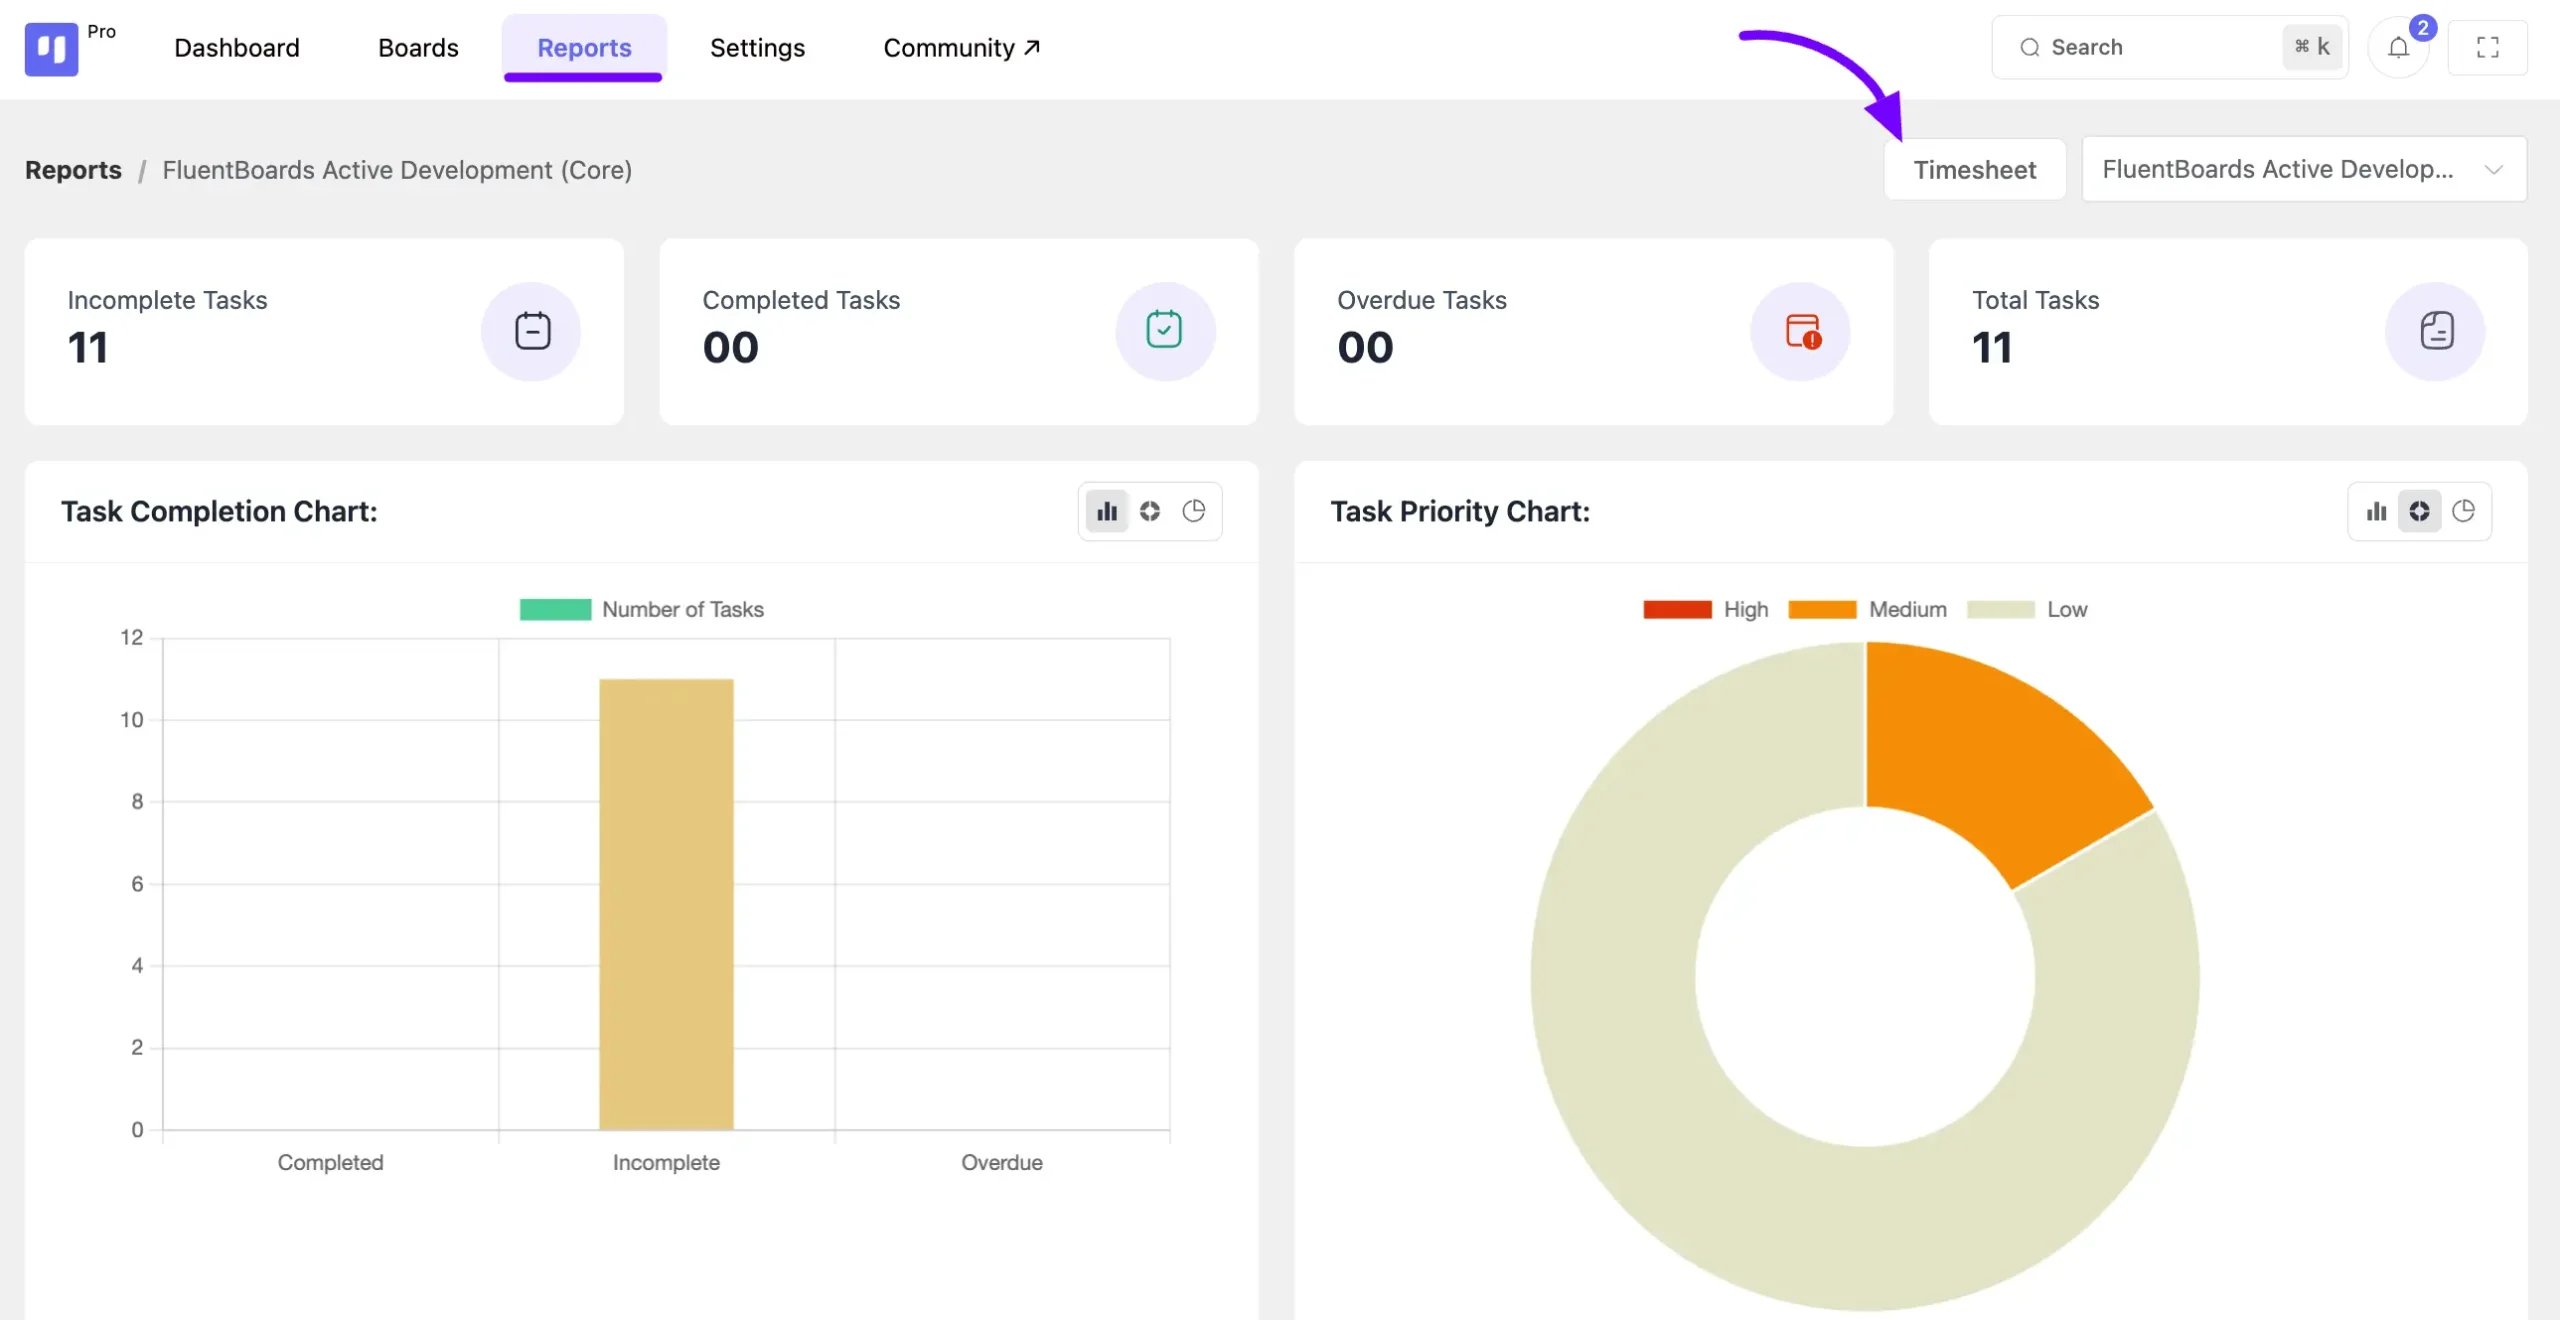
The Timesheet displays the time your board members have spent on tasks. This report is based on the estimated time and logged time set in each task.
Click on the Timesheet button in the Reports section, and the Timesheet page will appear.

From the Timesheet page, select the specific board from the dropdown menu to view the timesheet or work log of the board members. To see timesheets based on individual tasks, click on the By Task button.

Click on this By User button to see the Timesheet based on user.

Here you will get a Date Filter option so you can see the timesheet of your board members in a more specific way.

You can export your timesheet in CSV format by clicking on this Export button.

That’s everything covered in the Reports section of FluentBoards. If you have any further questions about the reports, feel free to ask.


